You caught a beauty!!!
Download PDF of scaffold here.
Download PDF of scaffold here.
theory behind scaffold…
Creating and using concept maps tends to have a high positive impact on student achievement.* Concept maps (graphic organisers) help students to see how various pieces of knowledge relate to one another. It helps structure their thinking. ** Venn diagrams are one type of graphic organiser that illustrate similarities, differences, and relationships between concepts, ideas, categories, or groups. This scaffold takes the functionality of Venn Diagrams one step further and uses the dynamic of overlapping circles not only to make categories of information visible, but to actually be the venue through which – by analysing patterns – students can teach themselves new concepts. This is the fundamental goal of scaffolding – to create activities for students that help them pull on past knowledge to move into new knowledge – and to become more independent learners.
Here we use information from a social science class on maps – considering the hidden messages in different cartographic types. Through interaction and dialogue***, students will explore cultural divides and implicit perceptions based on world maps used in different parts of the world. By having the opportunity to talk about this on their own before reading about different opinions in textbooks or from other sources (direct teaching), learning will go deeper and be more meaningful for them in the long term.
*** You’ll see that we’ll need to give our students the academic language necessary to be able to talk about the concepts in the diagrams.
step by step…
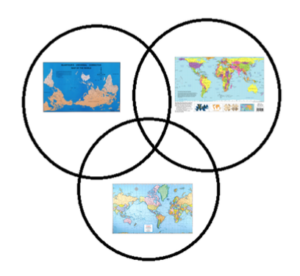
- Divide information from a unit you’re about to begin three ways in the 2-circle overlapping Venn Diagram. (Template here.)
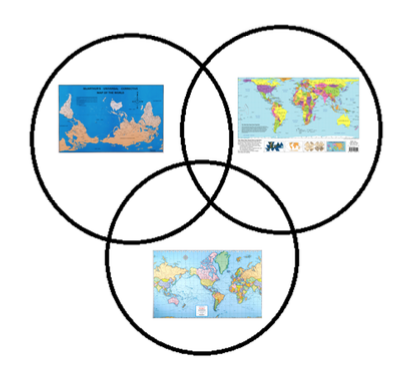
Where would you put these similarities?
- world maps
- northern hemisphere
- grids
- scale
- colour codes
- Make copies for every pair of students.
- Show the academic language **** necessary for students to be able to speak about the information effectively, and make sure they understand the meanings. They will also need to review vocabulary for comparing and contrasting. Model one or two observations before they begin the activity.
Example: Bricks: coordinates, grid, imagery, map projection, scale, continents, oceans, etc.
Mortar: centre, top, bottom, etc.
Student 1: In the map in the upper right-hand circle the continent of Africa is in the centre while in the map in the lower circle North and South America are in the centre.
Student 2: Yes. That’s an interesting difference. They are both world maps. That is common. So we can take ‘world maps’ from the textbox and write it in the circles between those two maps.
Student 1: The map in the upper left-hand circle is very different. The Southern Hemisphere is at the top of the map.
Student 2: That’s true. That’s a big difference. I see another similarity between the maps in the upper right-hand circle and the lower right-hand circle. The colour codes are very similar. The oceans in the upper left-hand circle are much darker. We can take ‘colour code’ from the textbox and put it between those two maps.
Student 1: Okay, but why do you think the Southern Hemisphere is drawn at the top of the map in the upper left-hand circle?
Etc.
- In pairs, students analyse the Venn Diagram, verbalise what they see, negotiate meaning, and write conclusions.
- Pairs share their conclusions with the rest of the class.
- Formative Assessment:
- Project different maps from the ones you’ve included in the handouts and continue the discussion about cartography. Include questions that might guide the discussion. (See possible questions on the last page of this scaffold.)
- Reflection: Students write 100-150 words on the process of considering the differences and similarities between the maps. They include how it felt for the teacher to trust them to be able to work out this connection with their partner instead of being taught it directly.
**** We use Jeff Zwiers’ concept of ‘bricks and mortar’ in identifying academic language, here. For more on this concept, you can read his article here.
Other Graphic Organisers to use in different scaffolds:
The Cycle: Circular Flow Charts
Possible questions to further discussion:
- What are some of the differences between the maps?
- Given the different locations of countries on the different maps, what cultural information or misinformation can come from a map of the world?
- How do you think a map can affect the way you or students in other countries see yourselves with respect to the world as a whole?
- How can maps be manipulative? How can they convey power or superiority, for instance? What other ways can they subtly change our perspective of the world-
- Can you imagine a map that avoids all types of ethnocentrism?
* (Hattie, 2012)
** (Mehisto, 2017)
*** You’ll see that we’ll need to give our students the academic language necessary to be able to talk about the concepts in the diagrams.
Activity Template
World Map – European Continent in Centre
World Map – American Continent in Centre
World Map – Oceania at the top
World Map – Proportionally Accurate

Scaffoldingmagic.com is your entryway into DYNAMIC bilingual learning methodologies, such as Phenomenon-Based Learning, CLIL, EMI, and ESL. You’ll find ways to implement critical thinking tools (DOK) to promote higher level thinking, the growth mindset, instill an ethic of excellence, deep reflection on learning, and all through multi-cultural, interdisciplinary activities. We have the keys to turning competences into action and to creating collective efficacy in your school so you move ahead as a unified, enthusiastic team.

